Forest 500 (Global Canopy), 2026
Redesigning how 500 companies get assessed on deforestation
Sole designer on the rebuild of Forest 500’s assessment platform, bringing data entry, quality review and company comments into one researcher workspace and one company portal.
Overview
One platform for a yearly assessment of 500 companies
Forest 500 is a Global Canopy project that identifies the 500 companies with the greatest exposure to deforestation risk, and assesses them every year on their policies and actions across nine commodities, from palm oil and soy to beef, cocoa and timber. Every score is based on publicly available information.
Behind each yearly cycle is a lot of work: researchers fill in every indicator for every company, reviewers check the scoring, and companies get a chance to comment on their assessment. I was the sole designer on the rebuild of the platform that supports all of this, replacing a legacy tool with one researcher workspace and one company portal.
The impact
The full assessment lifecycle now lives in one place, and the new flows were validated with Lovable prototypes built on the real indicator data before development started.
Problem
A legacy tool that made every step harder
The existing tool had grown over the years into a set of separate pages: company lists, data cleaning and even raw database queries, each with its own filters and little guidance. Researchers had to know where everything was, and the tool gave no overview of progress, of what needed review, or of who was working on what.
The company side had the same problems. Companies told Global Canopy that commenting on their assessment was hard work: drafts could get lost, there was no way to export the assessment to share it internally, and colleagues couldn’t work on it together.
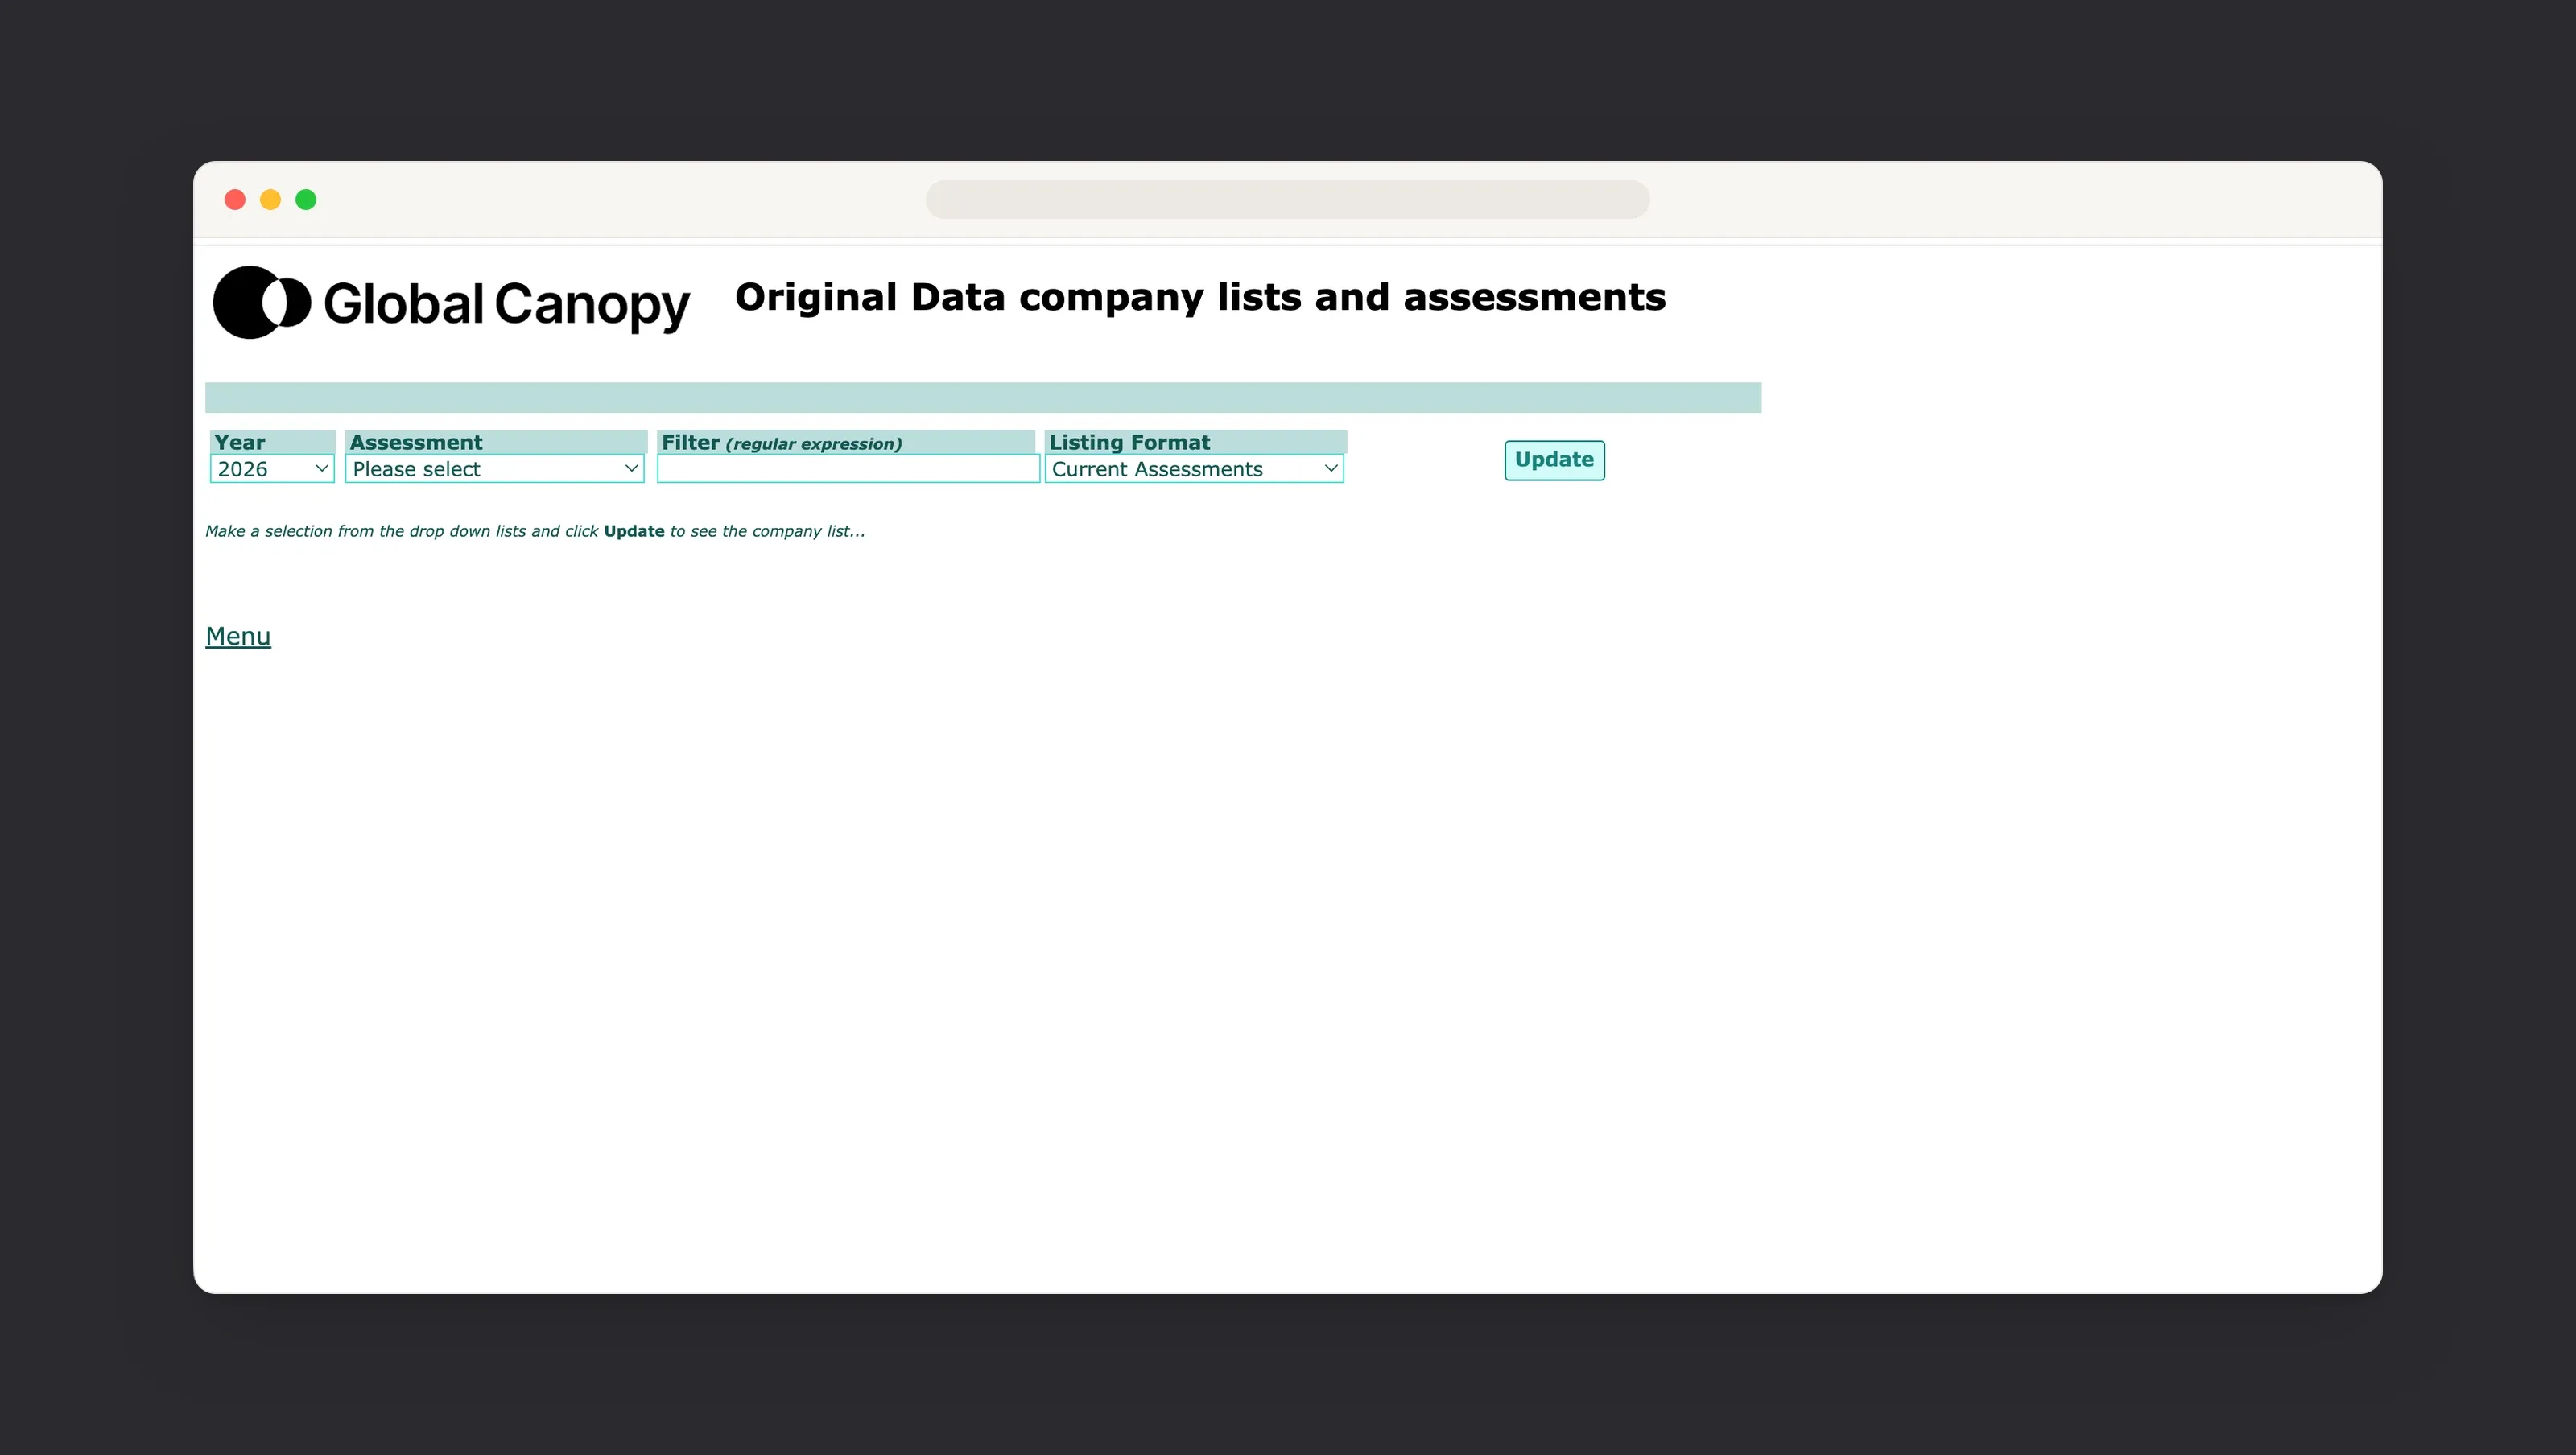
No overview
No single view of assessment progress, of what needed review, or of who was working on what.Scattered steps
Data entry, quality checks and company comments lived in different places, with different rules.Hard for companies
Lost drafts, no export and no way to collaborate made the comment period a chore.
Research
Mapping the full assessment lifecycle
I started by auditing the legacy tool and mapping every step an assessment goes through, and every role involved: researchers and research assistants, reviewers, admins and the companies themselves.
That map became the backbone of the platform. An assessment moves from data entry through automated checks to quality assurance. From there it is either sent back to the researcher with notes, or approved and locked for the company comment period.
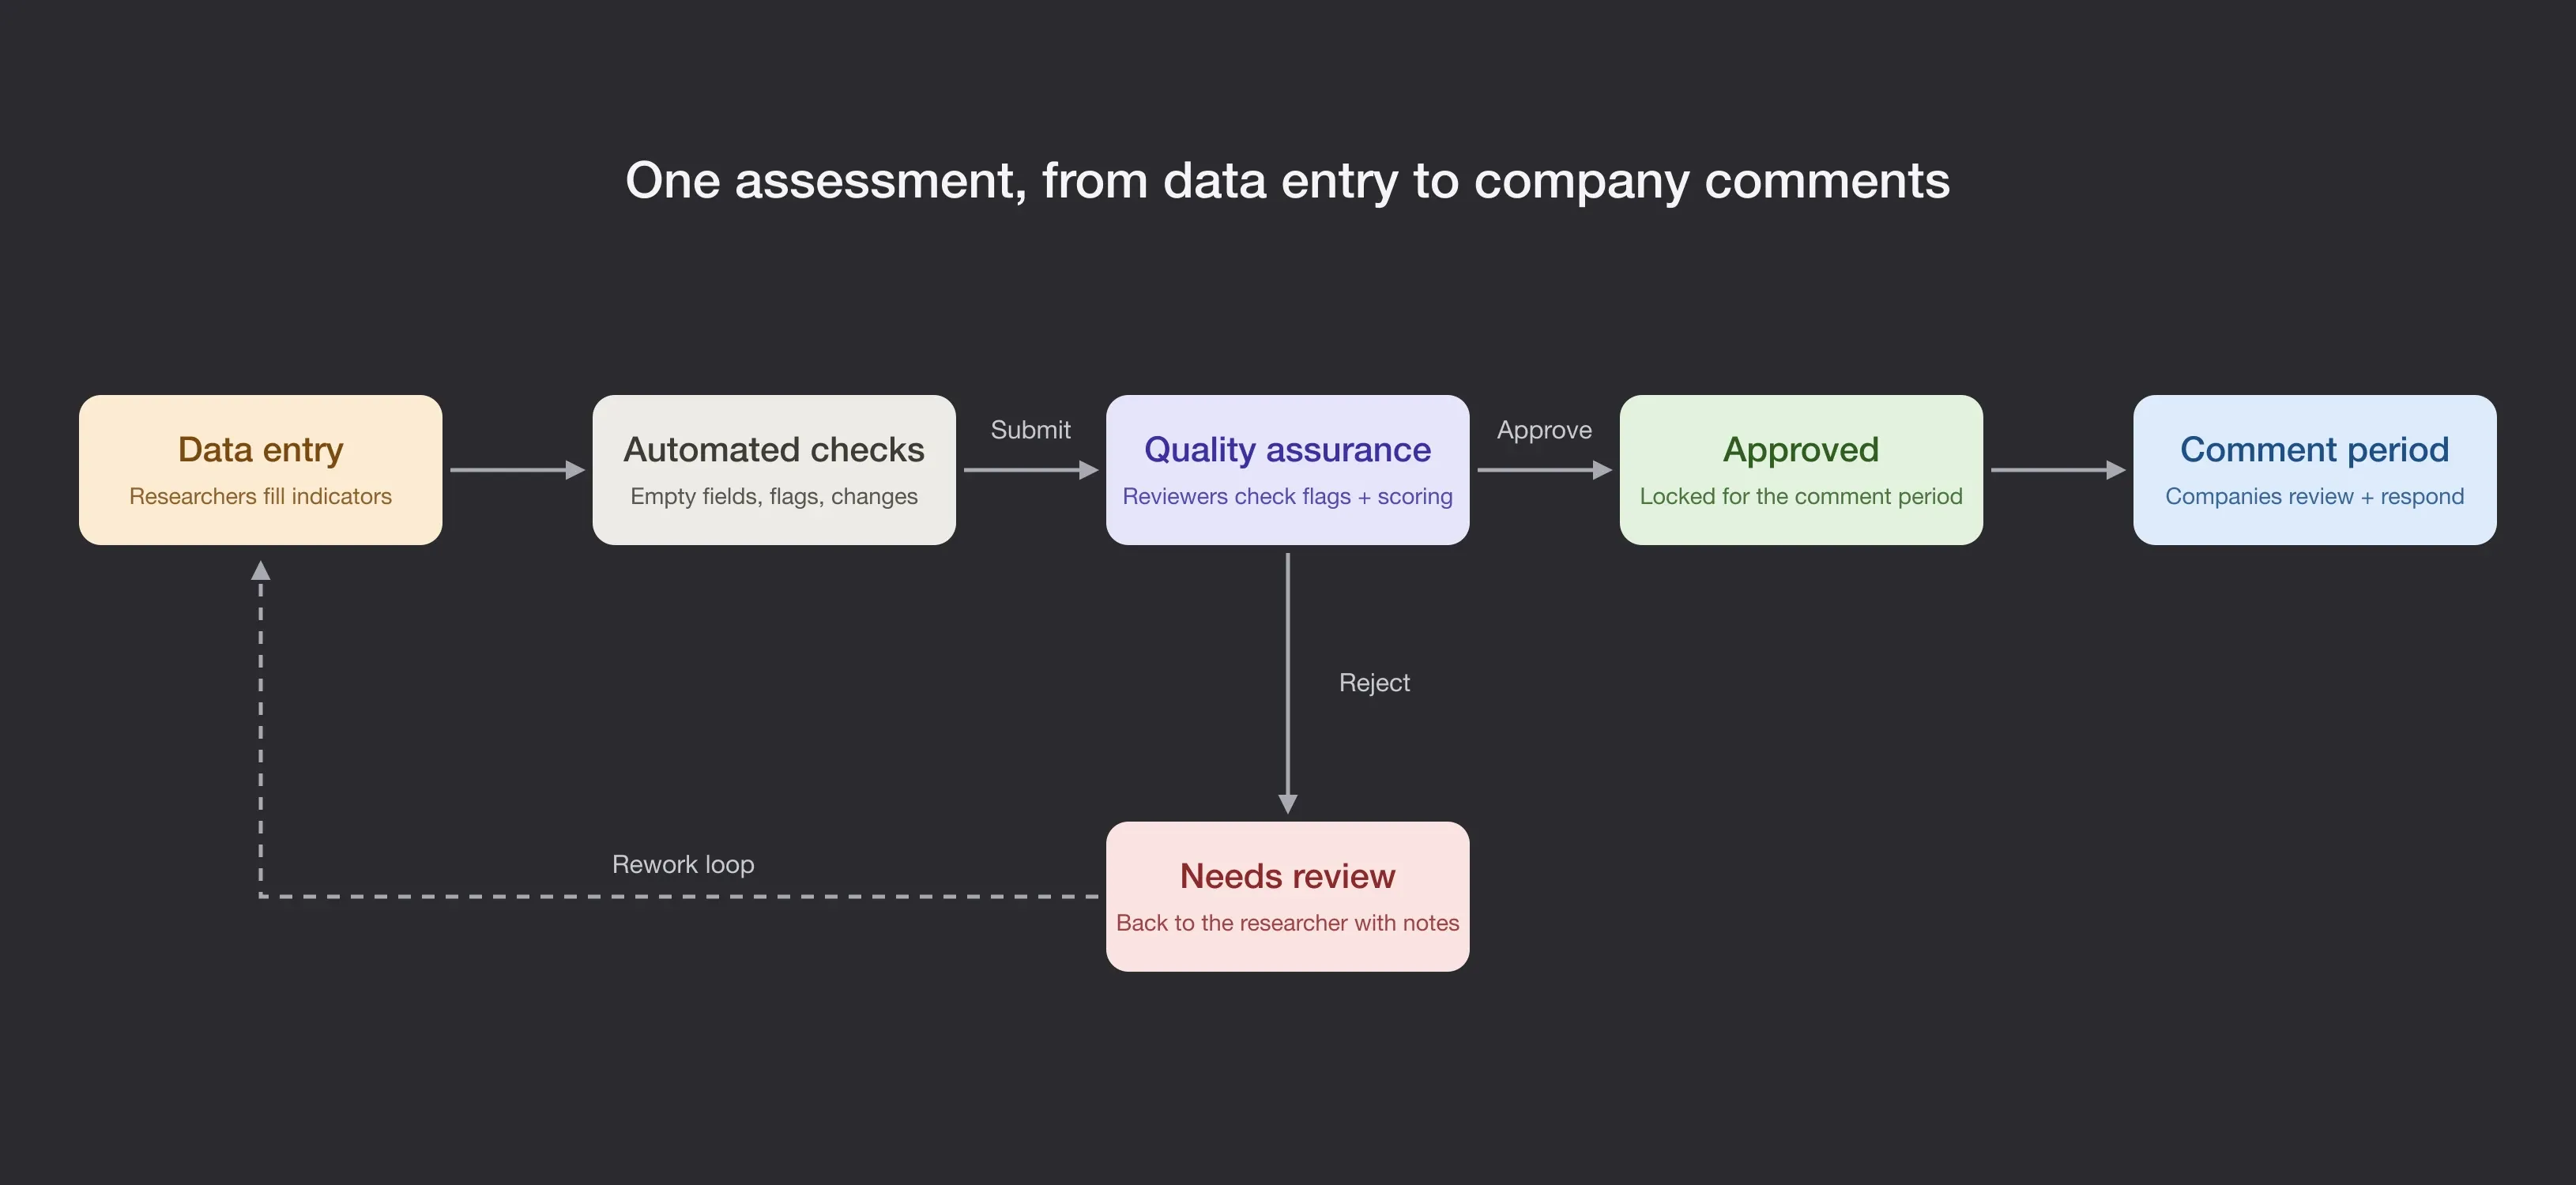
Mapping it this way surfaced the questions that shaped the design, like who moves an assessment into review, whether that happens per company or per section, and how clearly the platform needs to separate company and financial institution assessments, which follow different methodologies.
Ideation
Prototyping on the real indicator data
I split the platform in two: a workspace for the research team, and a portal for companies to review their assessment and respond.
Instead of testing with placeholder content, I built Lovable prototypes on the real indicator questions and answer options. The research team could click through a full assessment as it would really look, which made feedback far more concrete and helped us settle questions about structure and wording early.
Designs
A researcher workspace and a company portal
Assessments at a glance
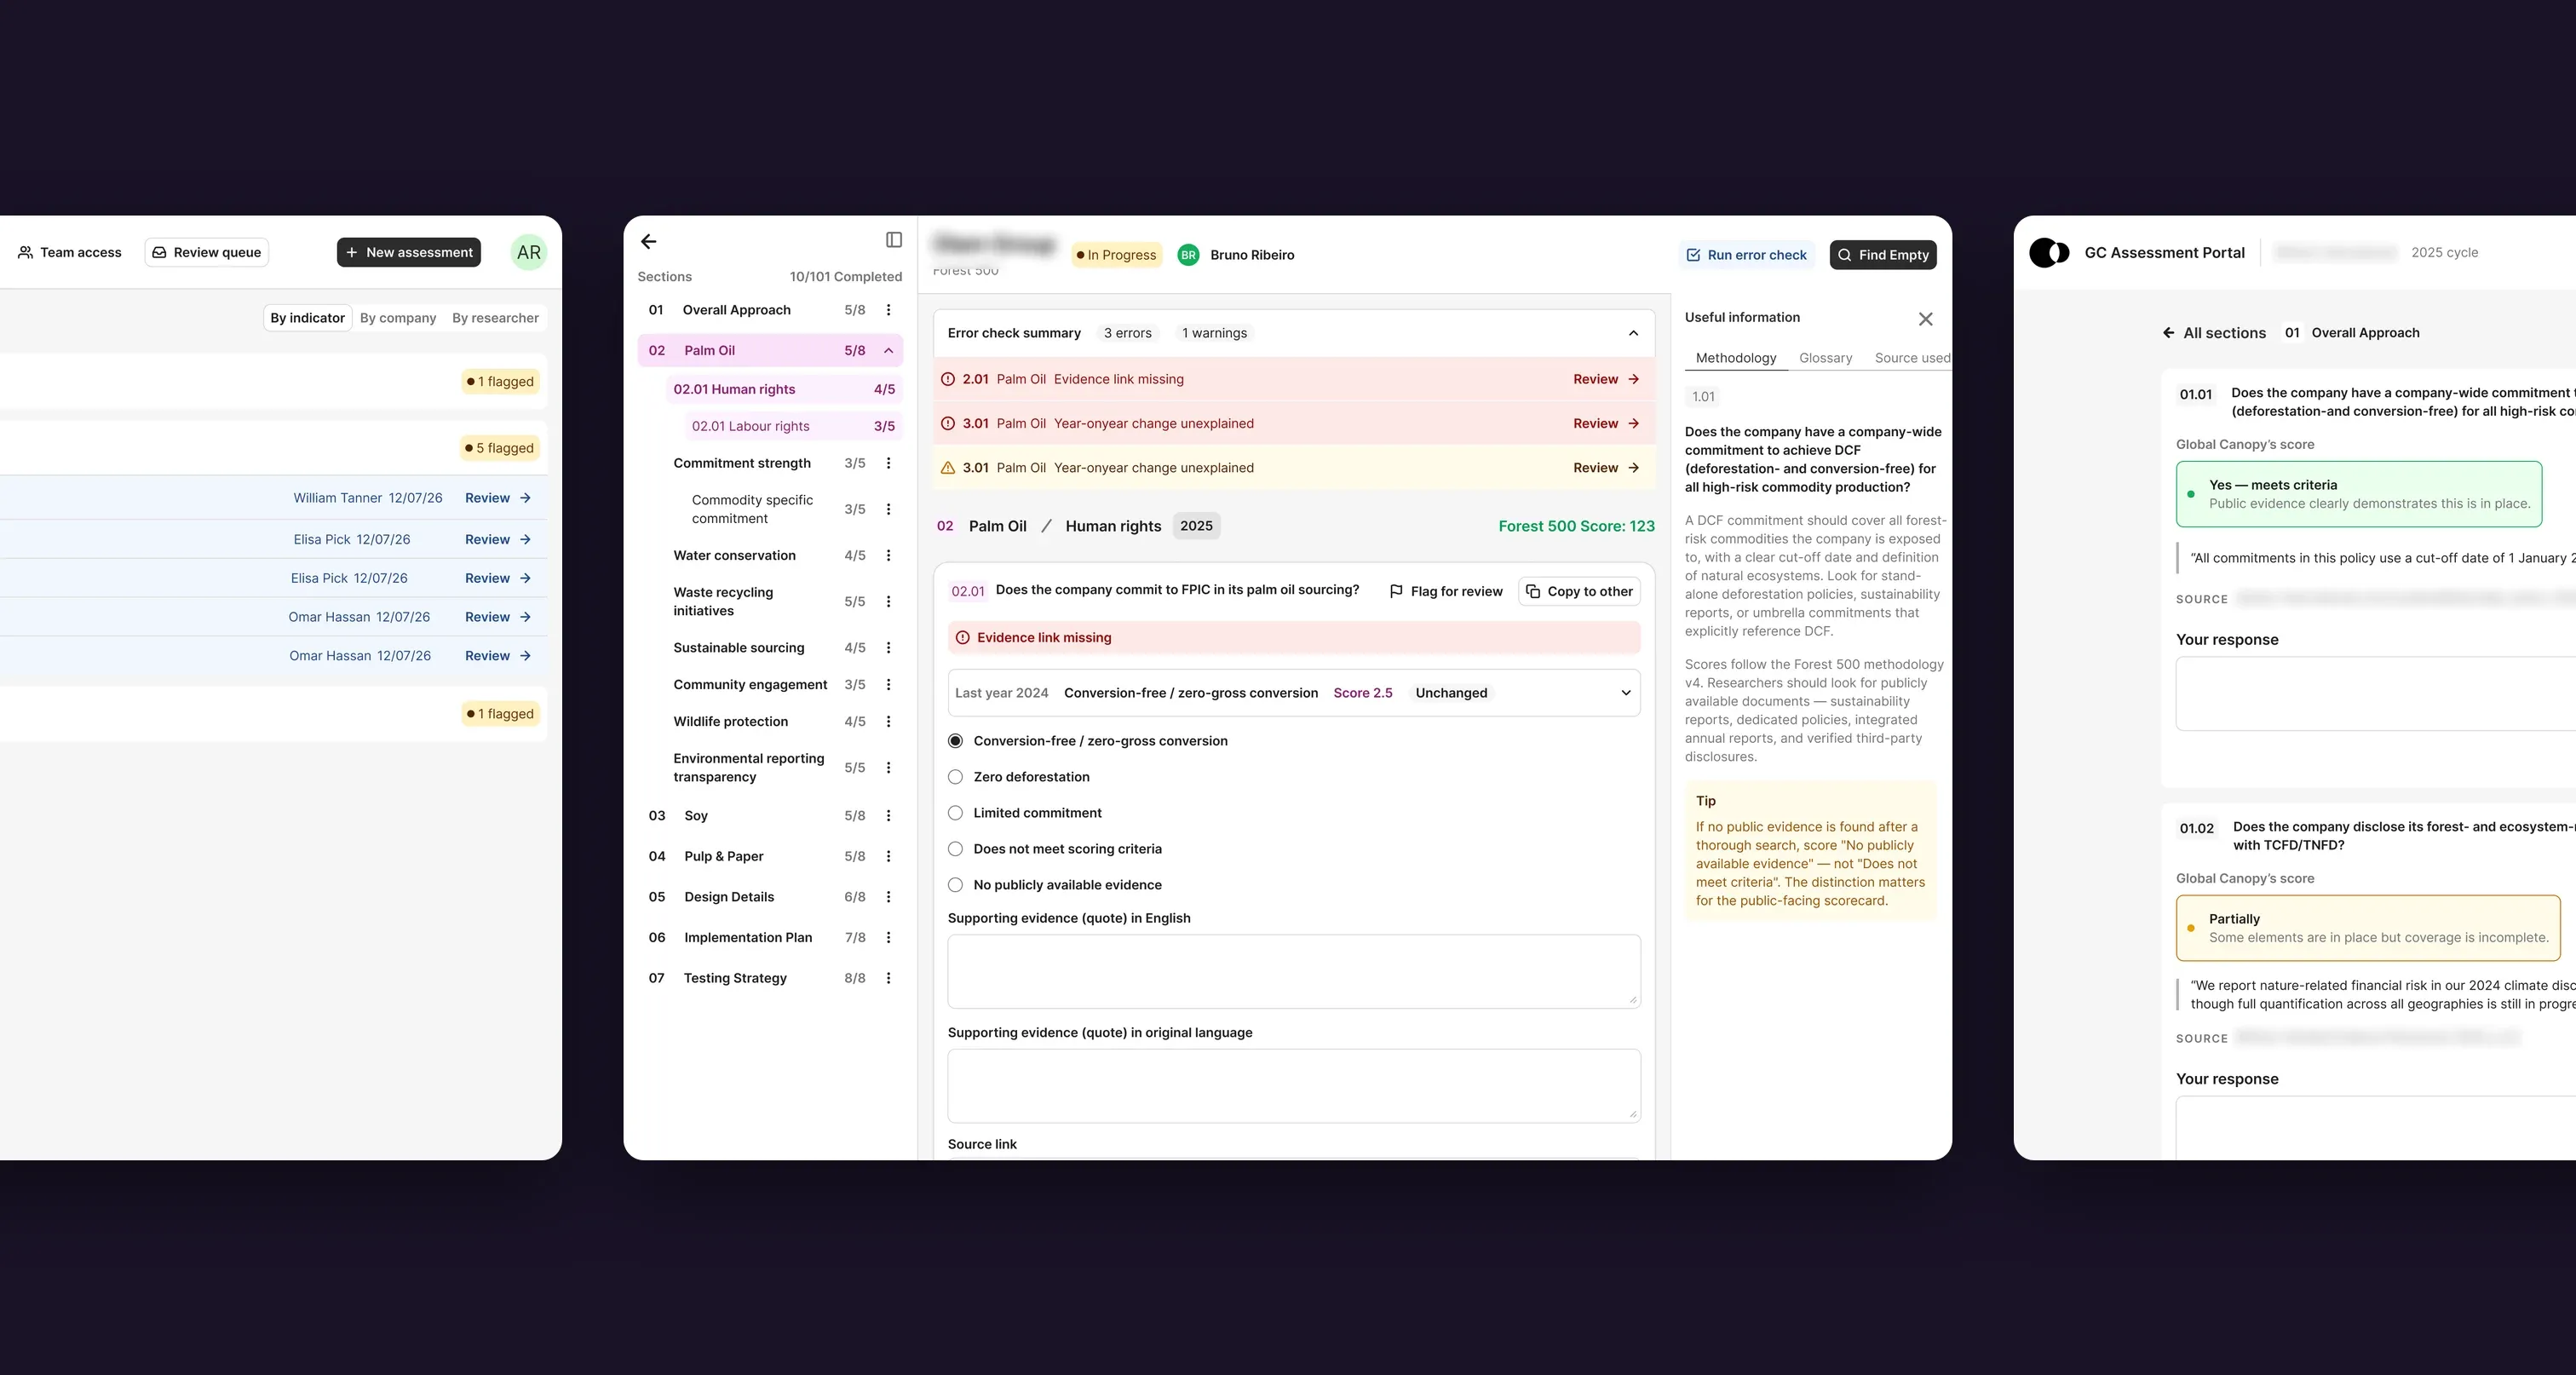
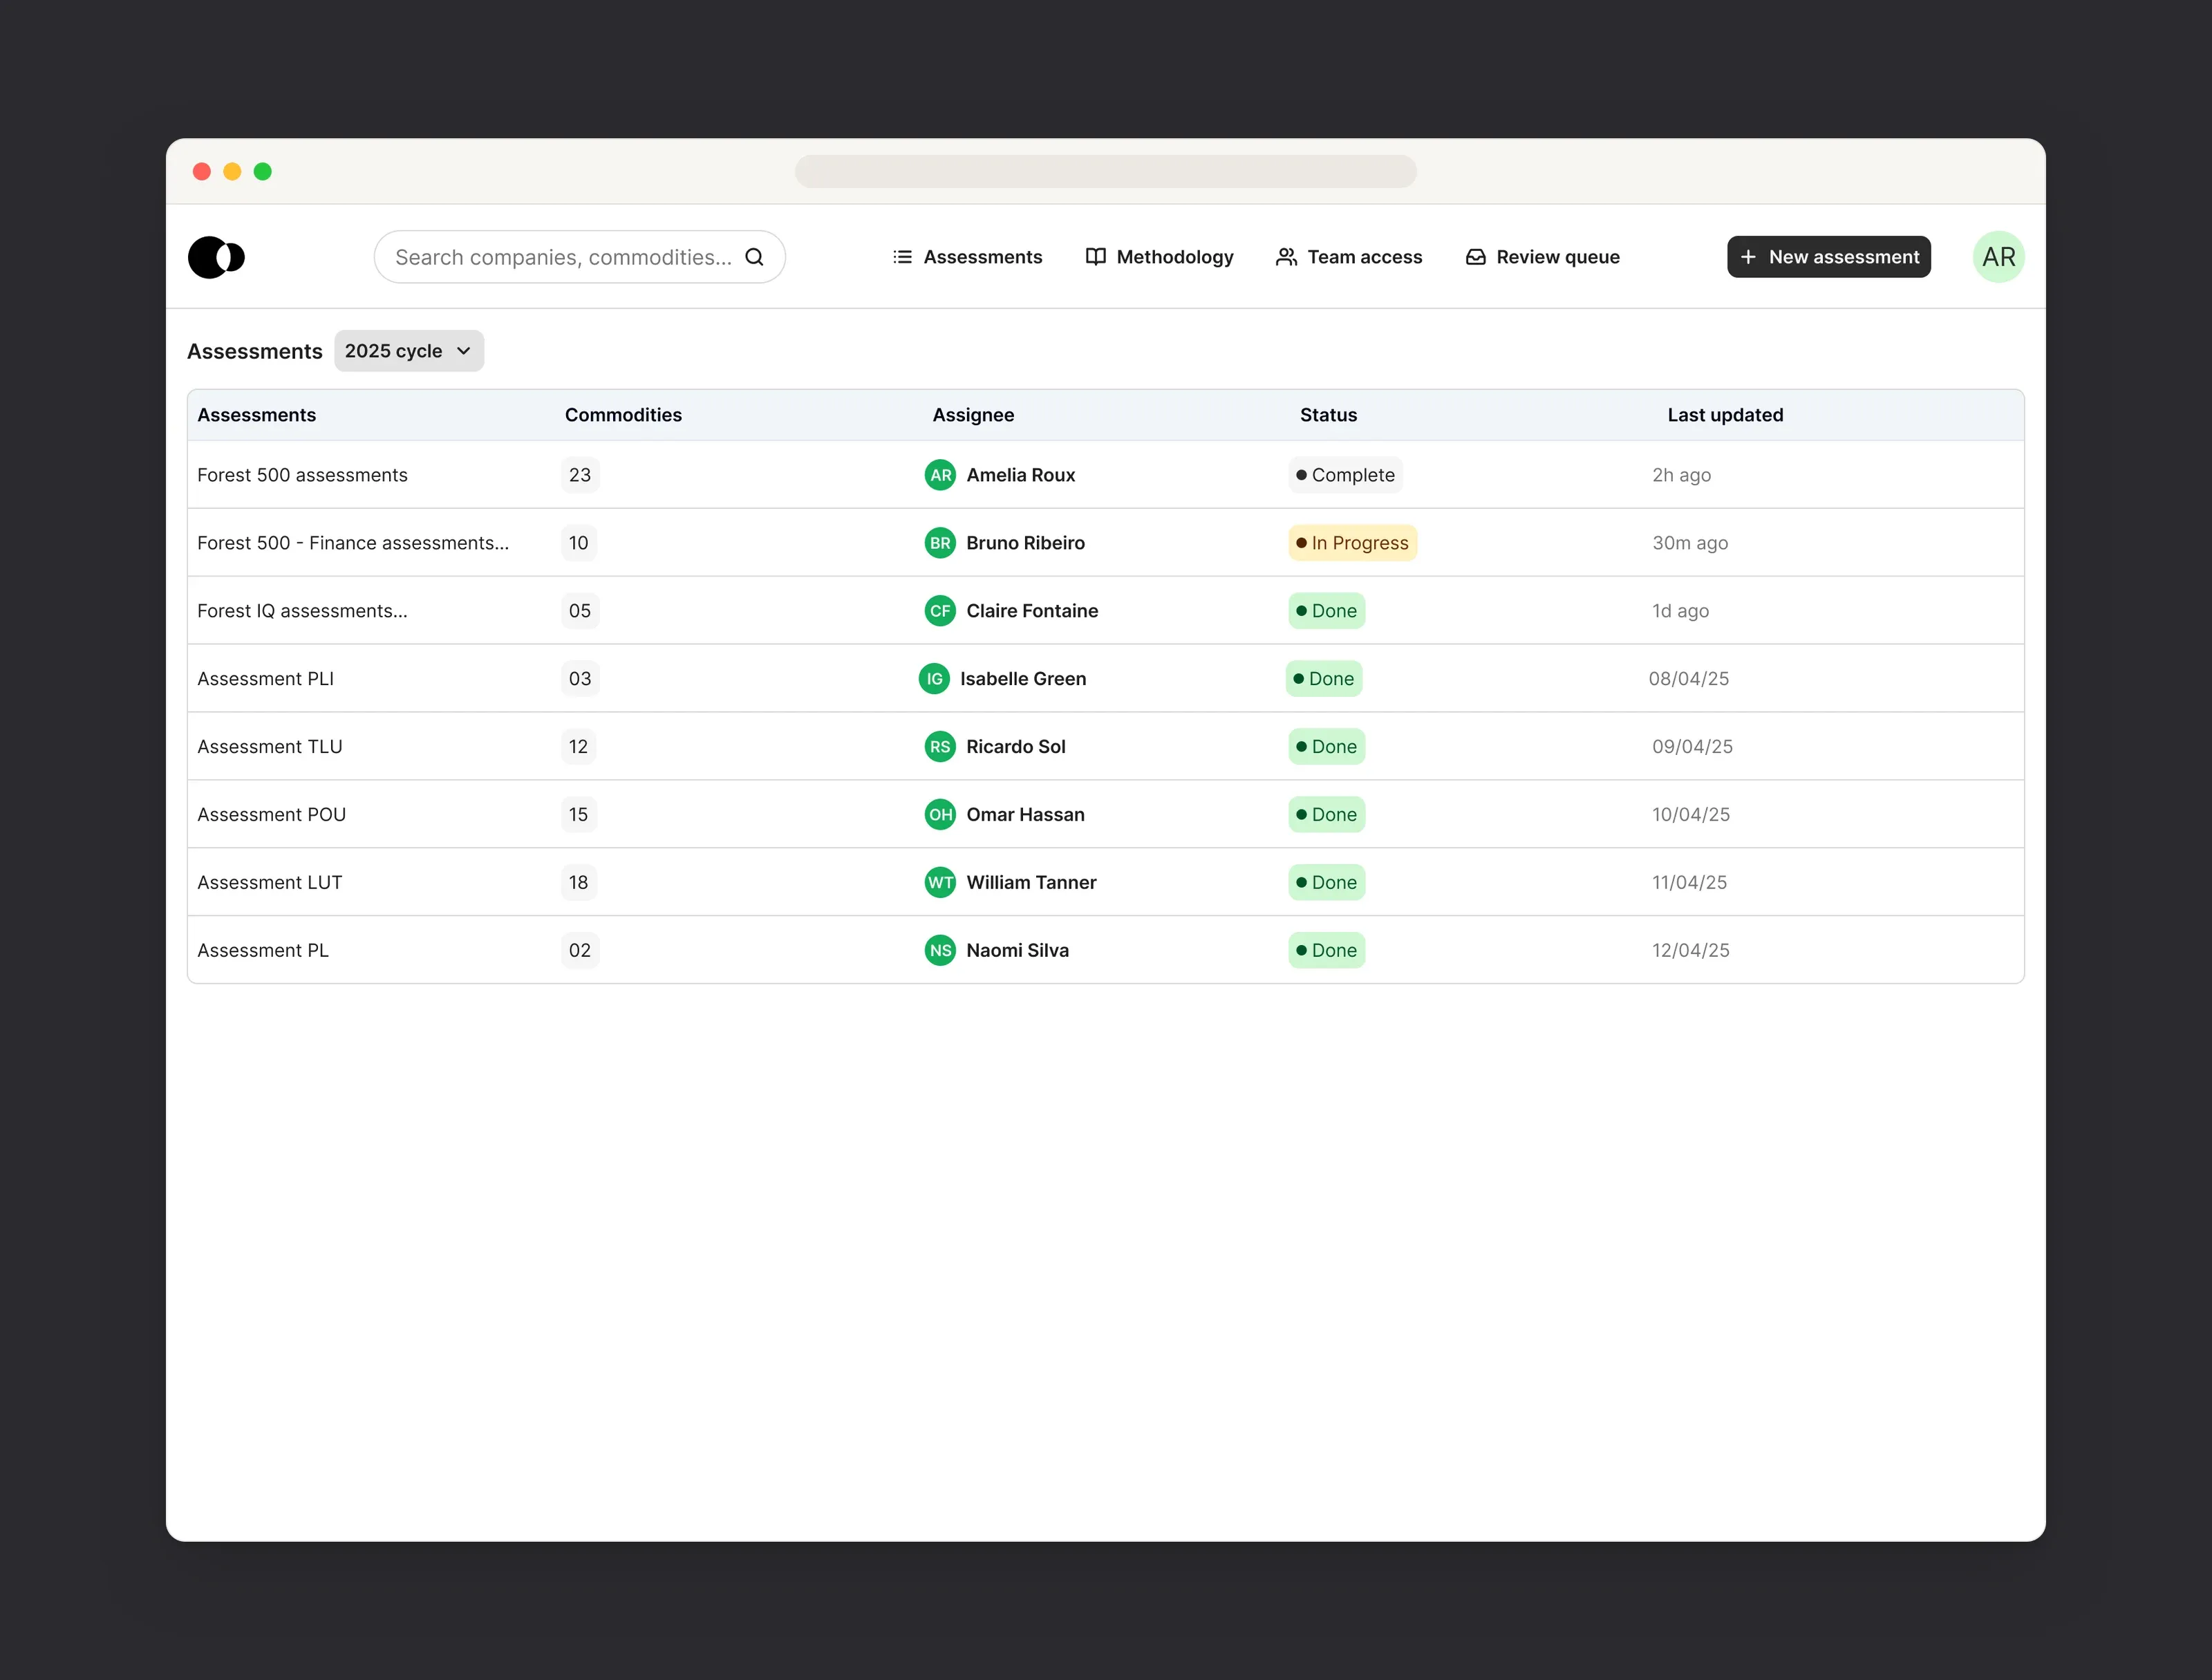
Researchers start from a list of every assessment in the cycle, with its assignee, status and last update, so the team always knows where things stand.
The assessment editor
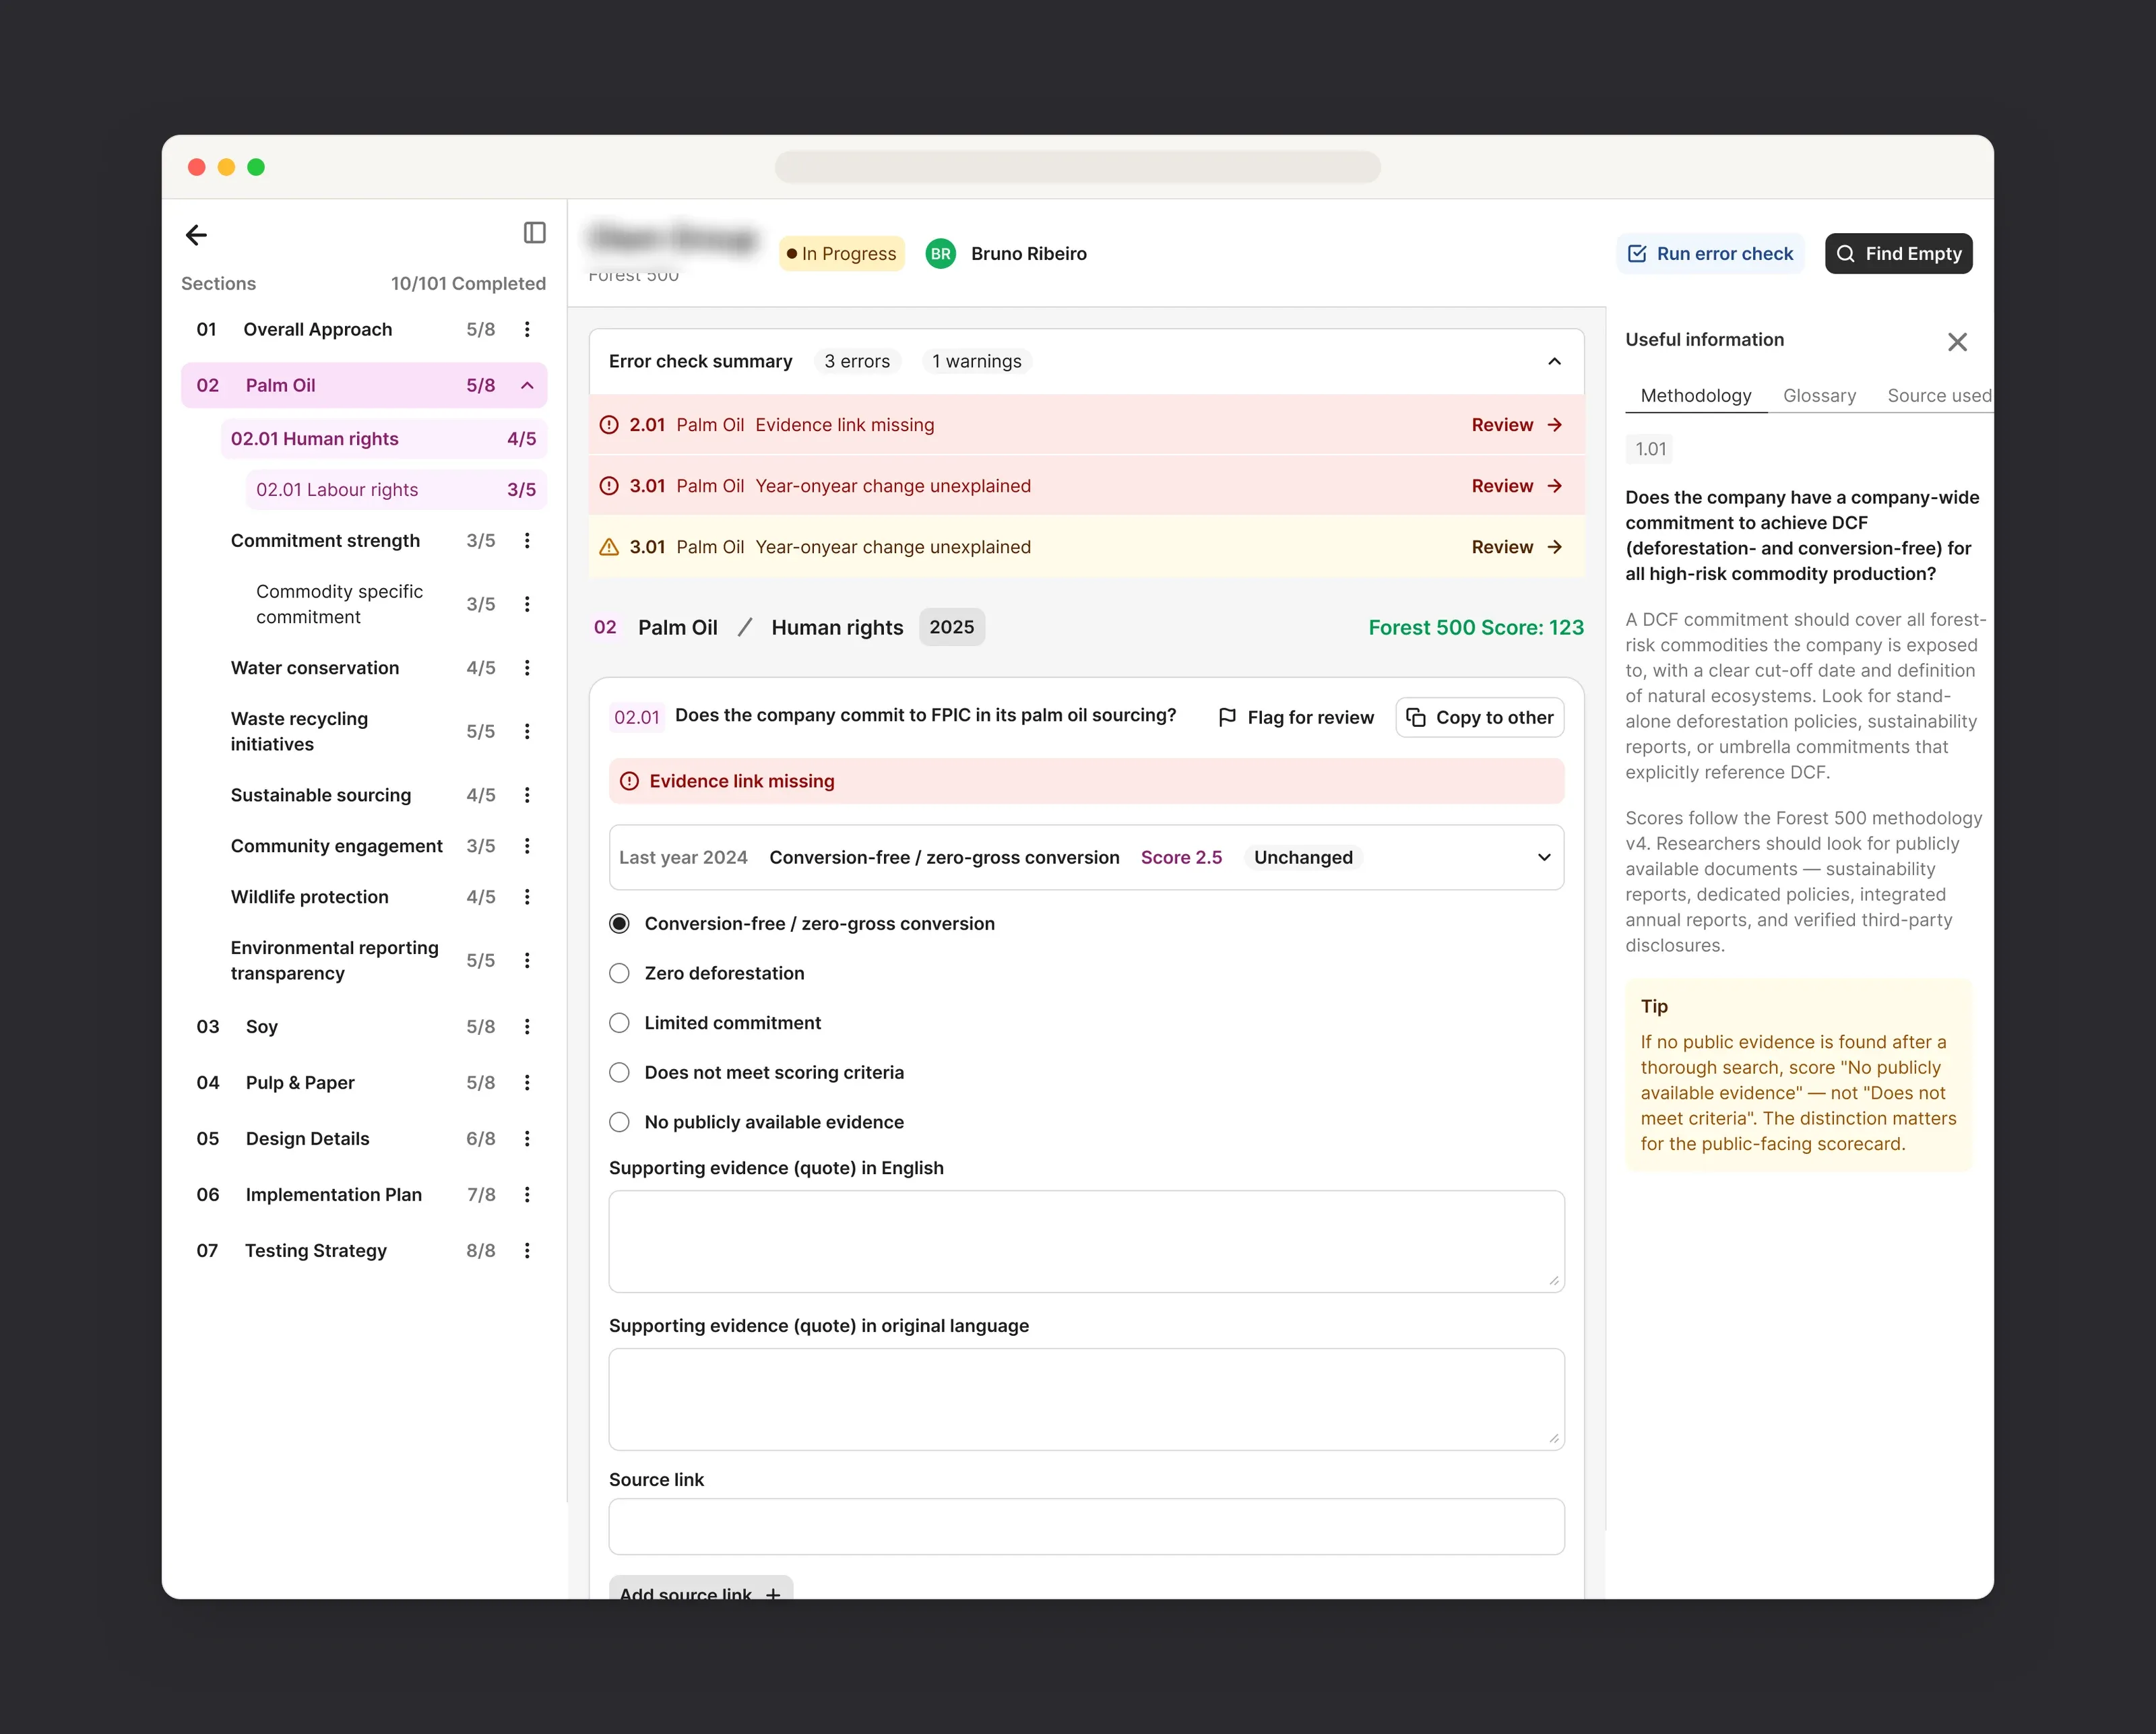
The editor is built in three columns: the sections and their progress on the left, the indicator in the middle, and the methodology guidance on the right. Last year’s answer sits right above the new one, and a built-in error check lists missing evidence or unexplained changes and links straight to the indicator to fix.
Quality review
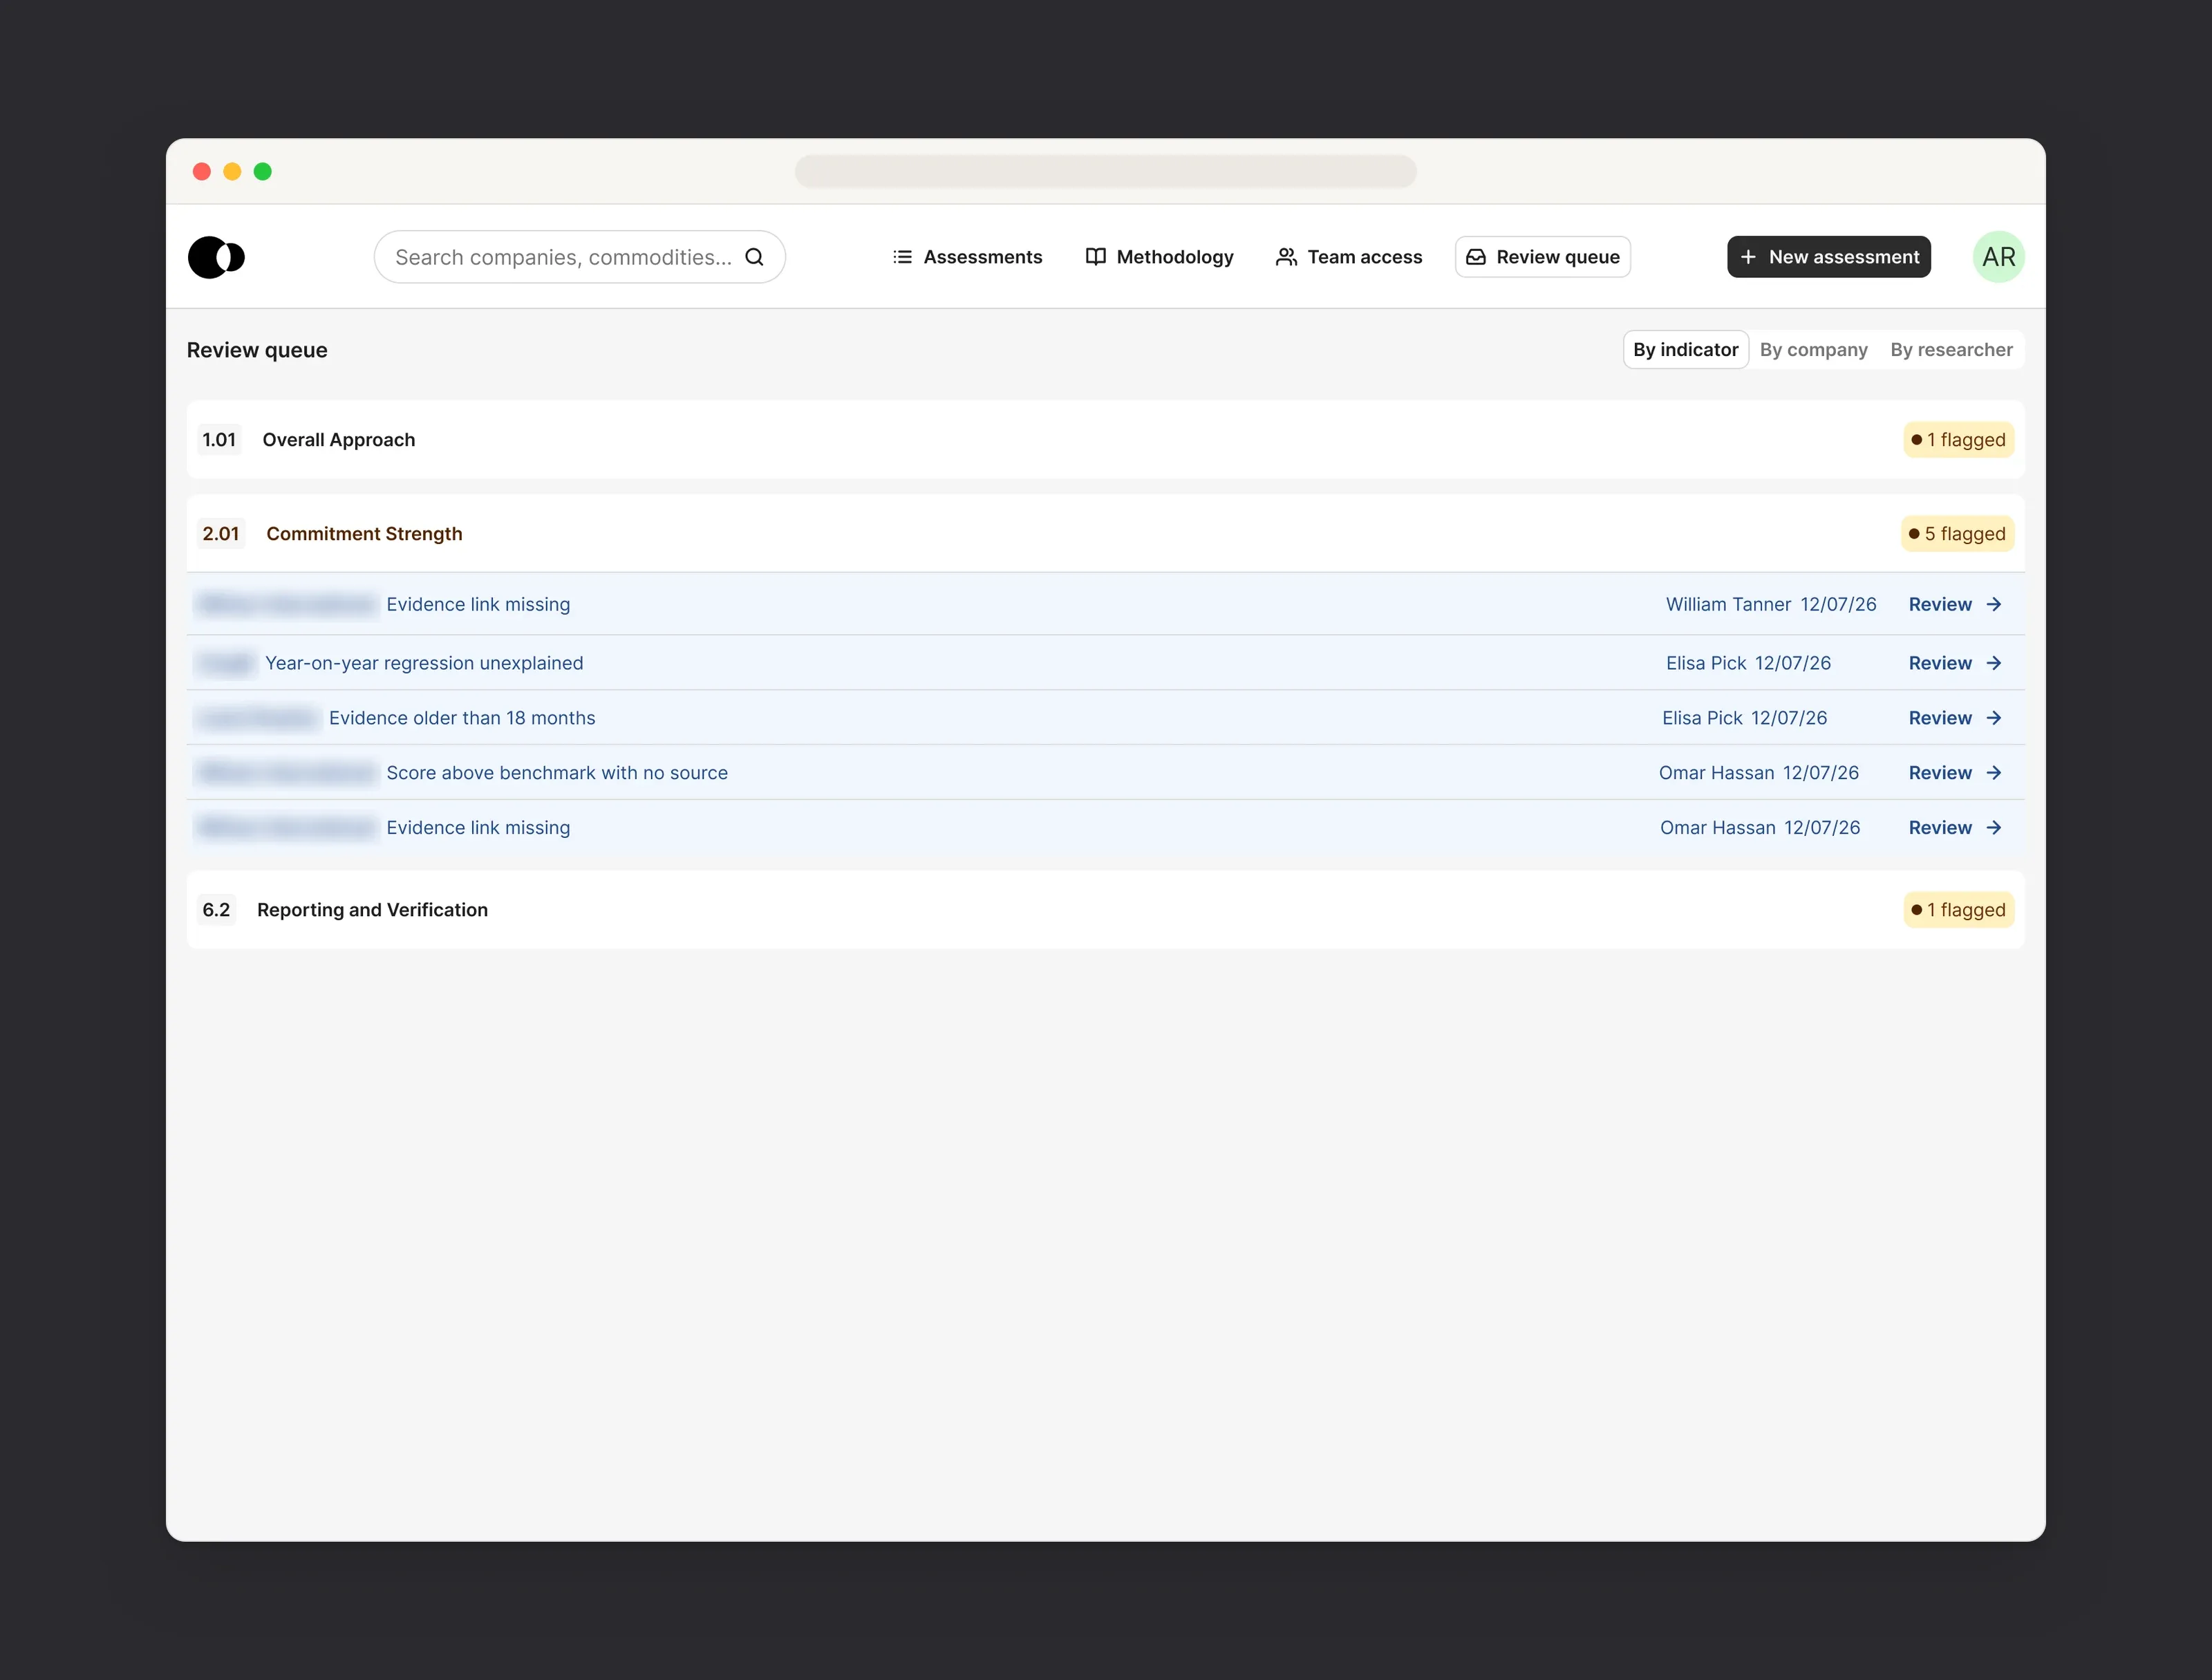
Reviewers get a queue of flagged answers, grouped by indicator, company or researcher, so they can check similar issues together instead of opening assessments one by one.
The company portal
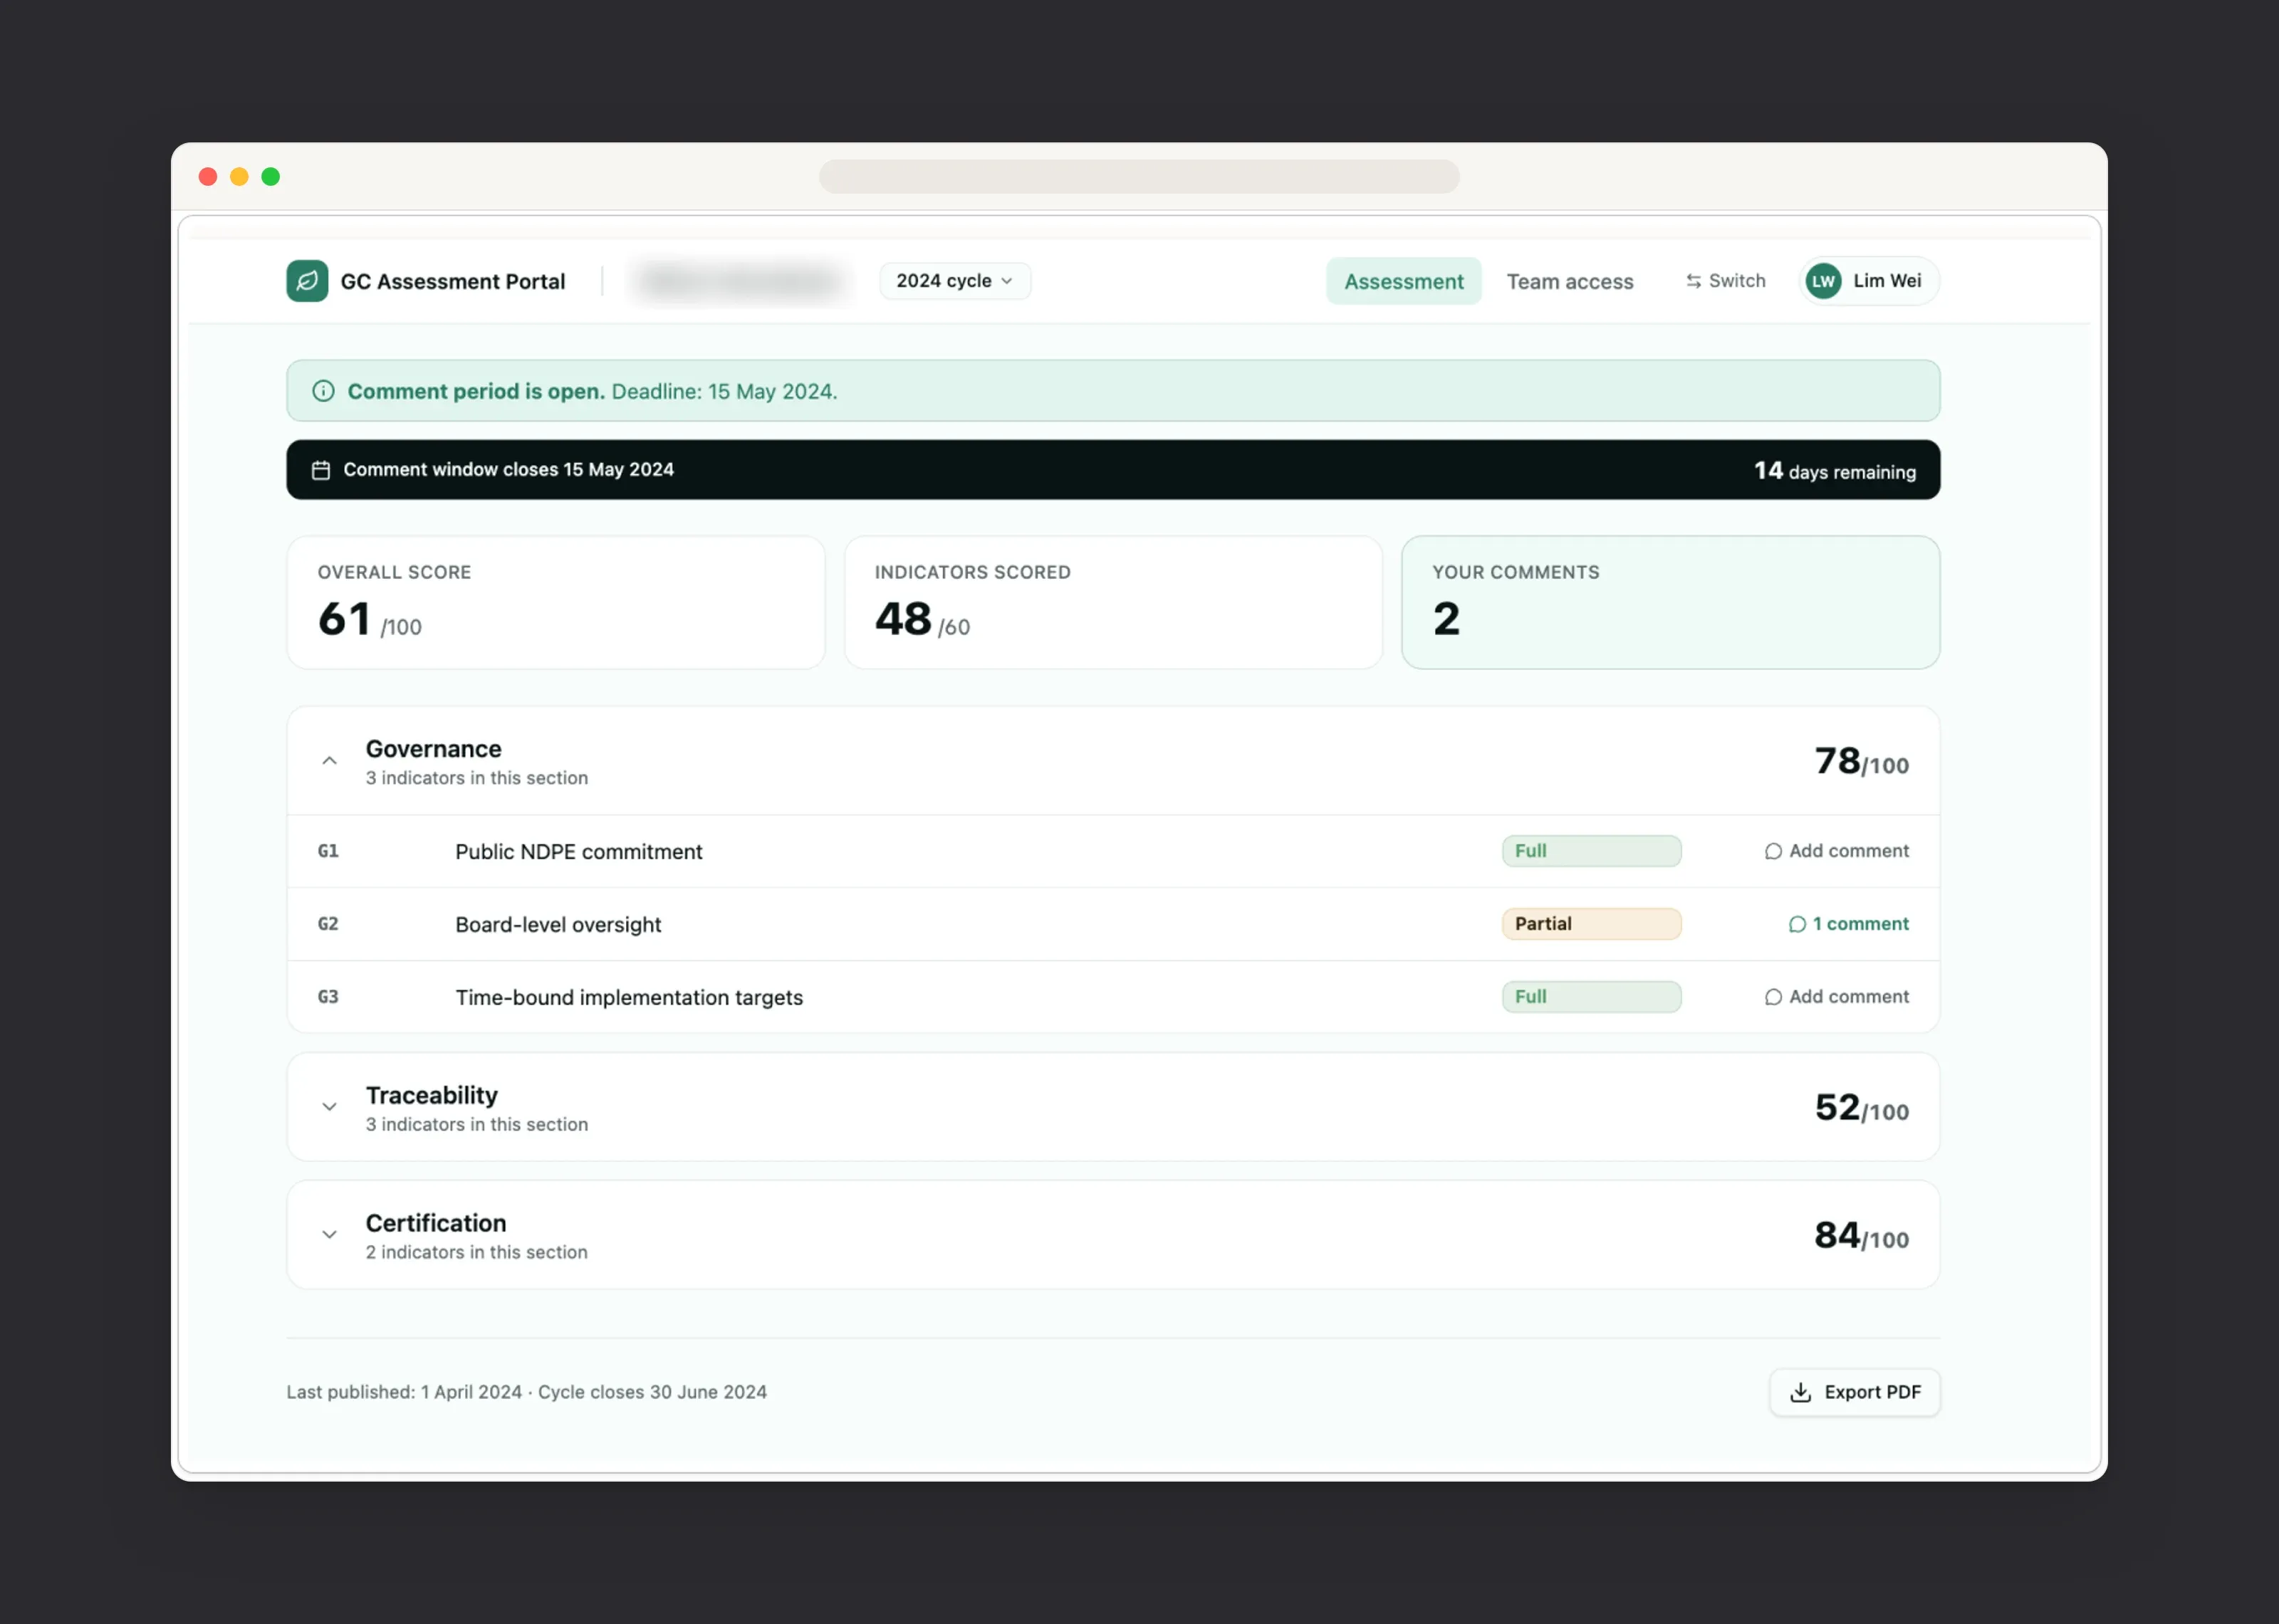
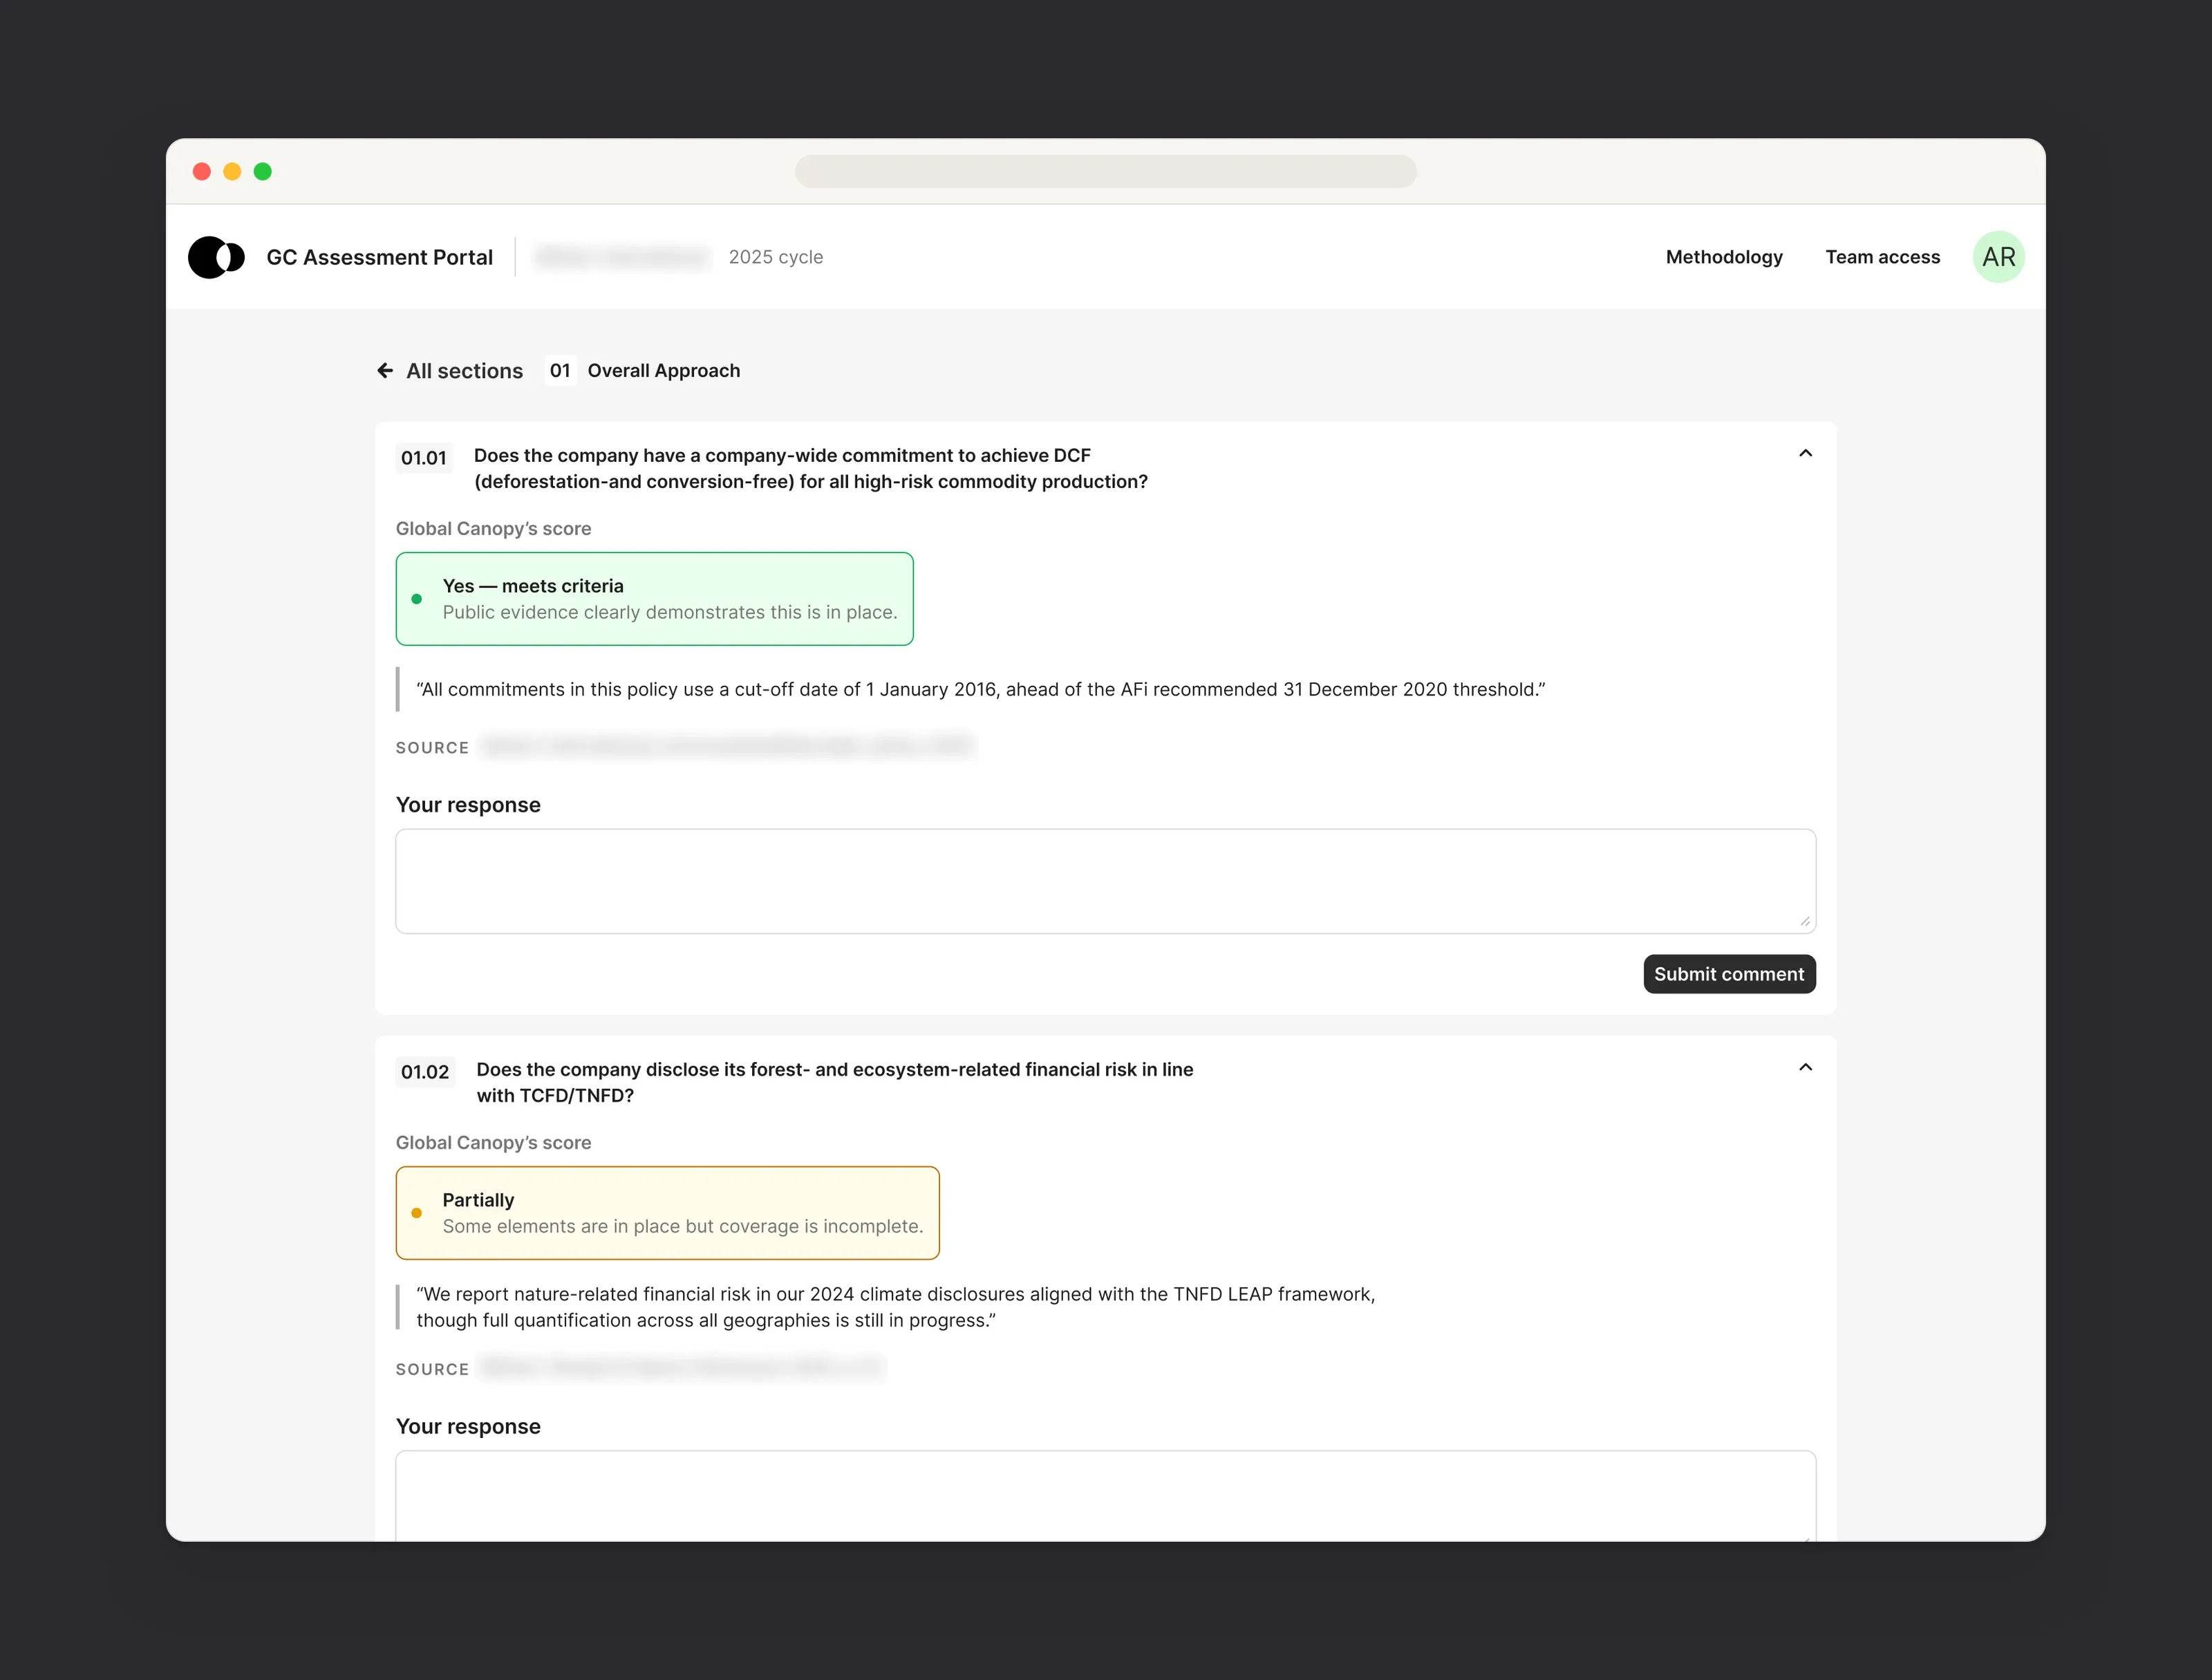
Companies see each indicator with Global Canopy’s score, the supporting quote and its source, and can respond right below it.
Context next to the task
Methodology, last year’s answer and the evidence sit next to each indicator, so researchers don’t have to switch tools.
Errors caught early
Automated checks flag missing evidence and unexplained changes before an assessment reaches review.
Built for teams
Clear assignees, statuses and a warning when someone else is editing the same assessment.
Fair to companies
Companies see the score, the quote and the source behind every answer, and can respond in context.
Lessons
What I learned
Map the lifecycle before the screens. Agreeing on who does what, and when, answered most of the design questions before I drew a single screen.
Prototype with real content. Building on the real indicator data made feedback specific, and showed problems that placeholder text would have hidden.
Small distinctions matter in scoring tools. Details like the difference between “No publicly available evidence” and “Does not meet criteria” change what ends up on a public scorecard, so the guidance needs to sit right where the decision is made.